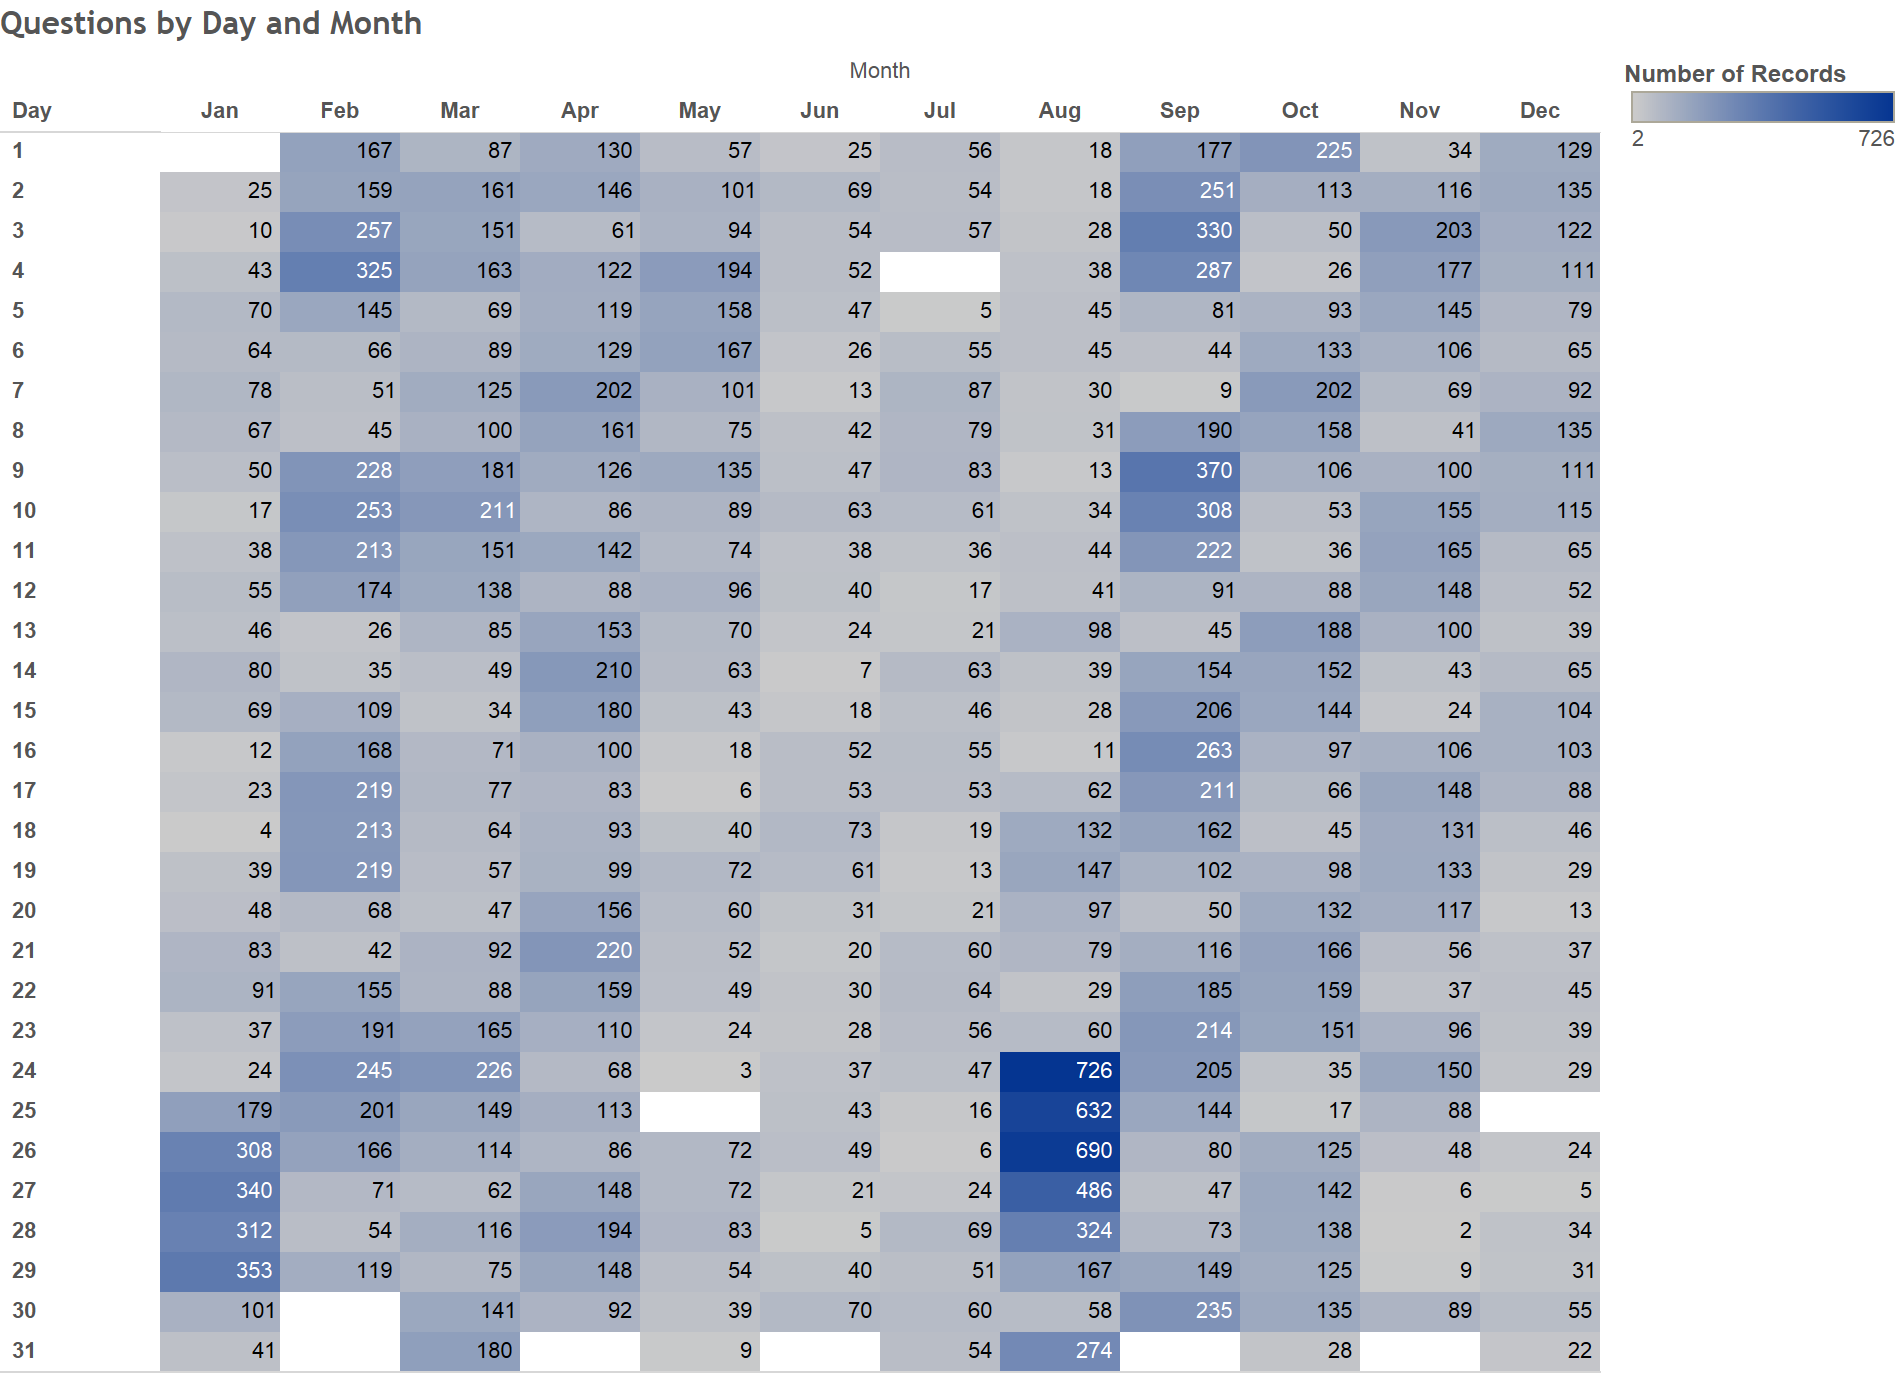
Tableau is a data visualization and sharing tool that makes it easy to create meaningful charts and stories around all kinds of data. The tool, which is available in both free and paid versions, has a simple drag-and-drop organization that can help all levels of users look like data wizards. The public tool is great for sharing spreadsheet data widely. Below is an example I created with the public version of the tool to show our reference questions by month and day and look at trends for staffing the desk:

The paid version of Tableau has robust privacy and internal sharing features and is appropriate for business analytics and different data streams. Tableau is an improvement on existing data visualization tools and a potentially powerful platform for industries of all kinds, including higher education and libraries.
Latest posts by Laura Costello (see all)
- Oeuvre in the North Reading Room Student Art Gallery - November 2, 2017
- Meet Daniel Hess: Research & User Engagement Intern - April 10, 2017
- Join the University Libraries at the Art Crawl Today! - April 7, 2017

