
Did you know that answering survey questions doesn’t have to feel like a chore? What if sharing your opinion could be quick, visual, and even a little fun? And what if collecting feedback didn’t require designing and distributing a full-scale survey?
Overview
We piloted an interactive, cost-effective way to collect student input that is both engaging and fun. Instead of completing a traditional survey, students passing by could contribute directly to a data-collection board by placing a sticker, pushpin, or similar marker to represent their response. Each student became a data point in real time, creating a visual display of collective input.
The pilot had three primary goals.
- Increase student engagement by offering a low-stress, enjoyable way to participate.
- Quantify engagement by leveraging existing library traffic data to calculate response rates – an evaluation approach not commonly reported in similar activities.
- Lay the groundwork for future rollout and refinement by using insights gained from the pilot.
In most cases, even under a very conservative estimate, the approach exceeded the anecdotal campus-wide response rate of approximately 4% and could serve as a strong complement to traditional surveys. It is easy to replicate and adaptable for other departments interested in engaging, creative, visual approaches to data collection.
How the Pilot Worked
The pilot took place during the Fall 2025 finals period. Question boards were set up across three main study areas in Frank Melville Library: the North Reading Room, Central Reading Room, and Main Stacks. Each board posed a single question related to library use or services, student life, lighthearted topics, or AI-related themes.
A variety of chart types were tested, including count plots (bar charts), scatter plots, Venn diagrams, and pie charts. At each location, one or two boards were displayed at a time for a period of one to three days. In total, 12 different questions and 27 question boards were deployed over the course of the pilot.
Why Try Interactive Data Collection?
Using a very conservative estimation and after removing outliers, the data boards in this pilot achieved response rates ranging from 4.13% to 7.17%. These results exceed the anecdotal campus-wide response rate of approximately 4% and demonstrate the value of this method as a strong complement to traditional surveys.
Interactive boards can serve as an alternative for short or simple surveys, or as a discovery tool to test assumptions before investing in a large-scale, comprehensive survey.
What We Learned?
Opportunities
- This approach is visually engaging and invites exploration rather than commitment, which helps drive higher participation – even when response rates are estimated conservatively.
- It is low-cost, easy to deploy, and adaptable to many contexts.
- Boards can be used to cross-promote services by pairing a leading question with relevant resource information displayed alongside it.
- As students participate, they are exposed to different ways of presenting data, encouraging them to interpret, reflect on, and even critique chart design, which promotes critical thinking. This creates a natural educational moment and positions the activity as a data literacy tool.
Challenges
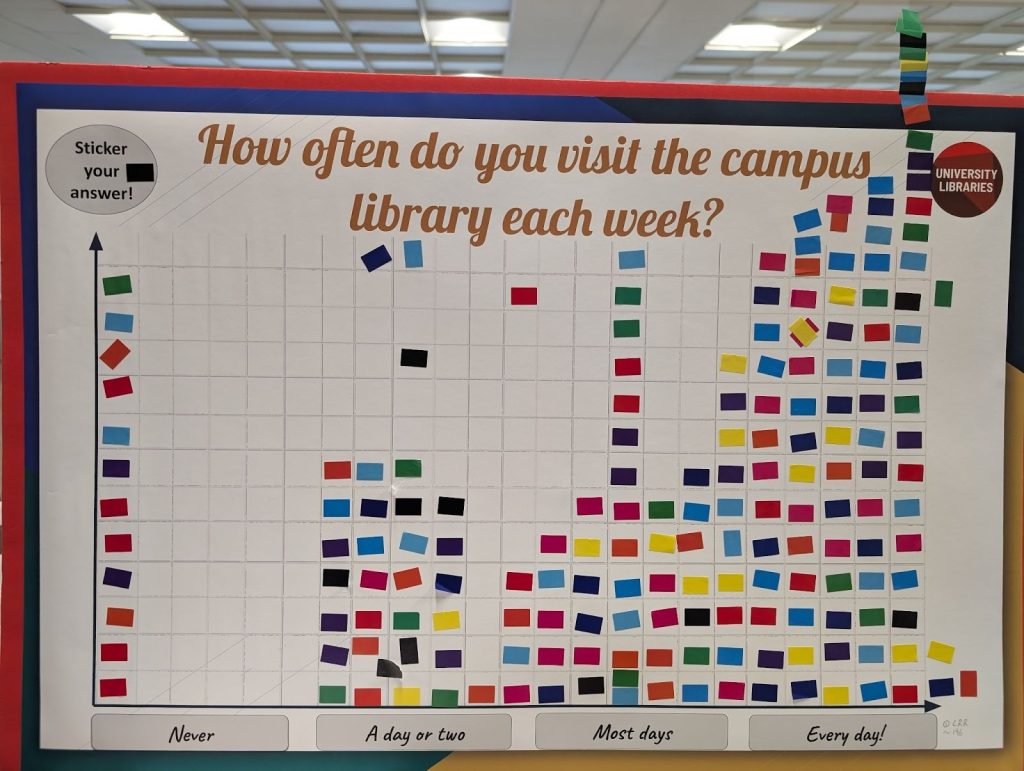
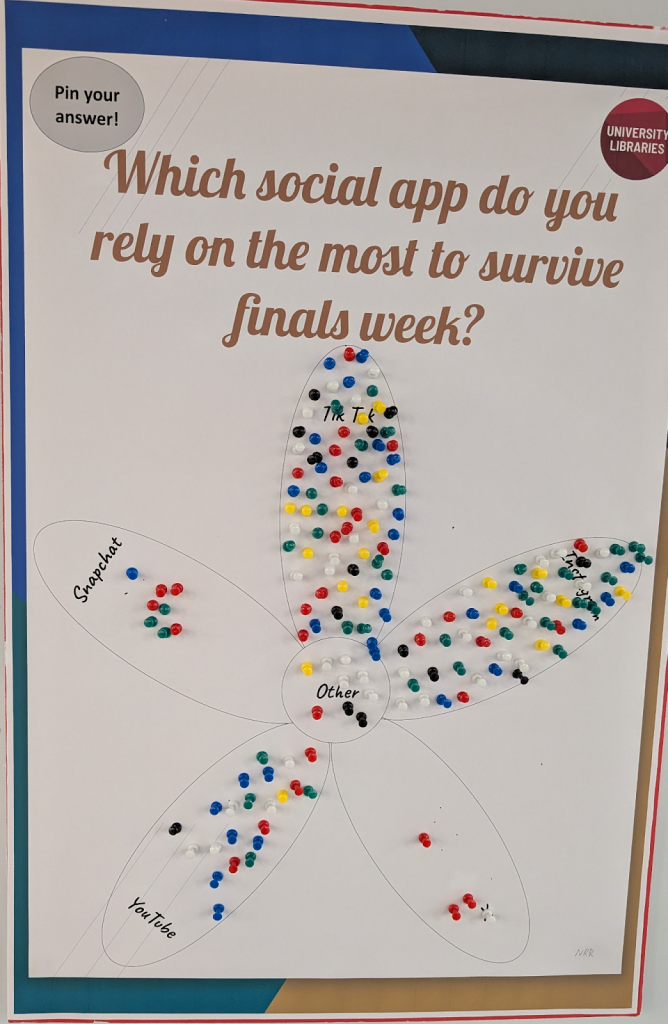
- Visible responses in real time, which may influence later participants. This effect is minimal for factual questions (e.g., library usage or social media habits) but more limiting for opinion-based prompts.
- Standalone question boards, which prevent analysis across questions or more complex statistical analysis.
- Time-consuming post-processing when responses are not placed in a consistent or orderly manner.
- The quality of responses is sensitive to both chart design and the level of interest a question generates. Responses may be constrained for two primary reasons.
- Unpredictable participation volume, which can lead to running out of materials (e.g., stickers of a particular color) or available space on the board. Limited space may cause responses to overlap or become obscured.
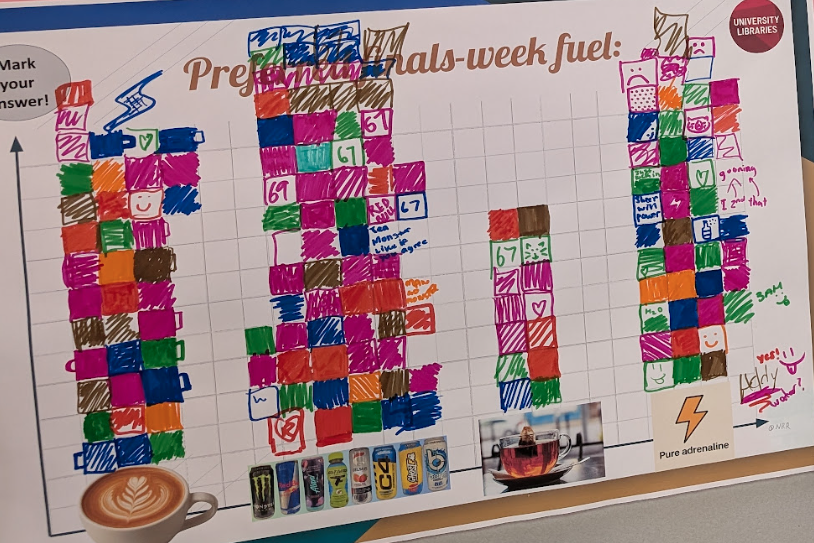
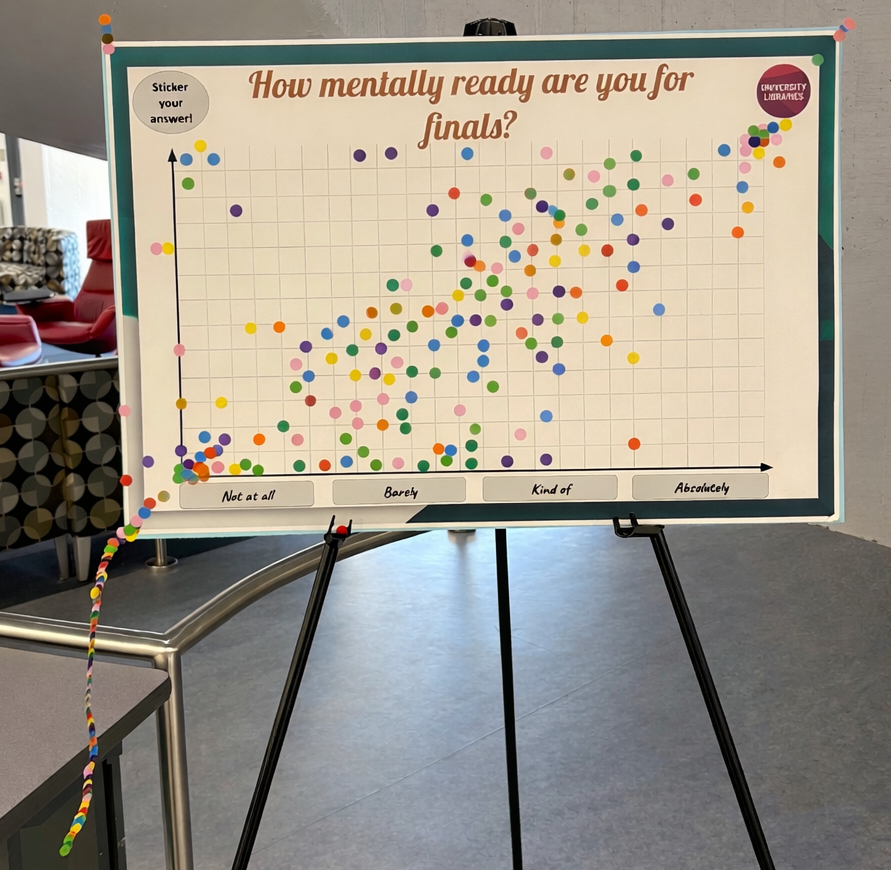
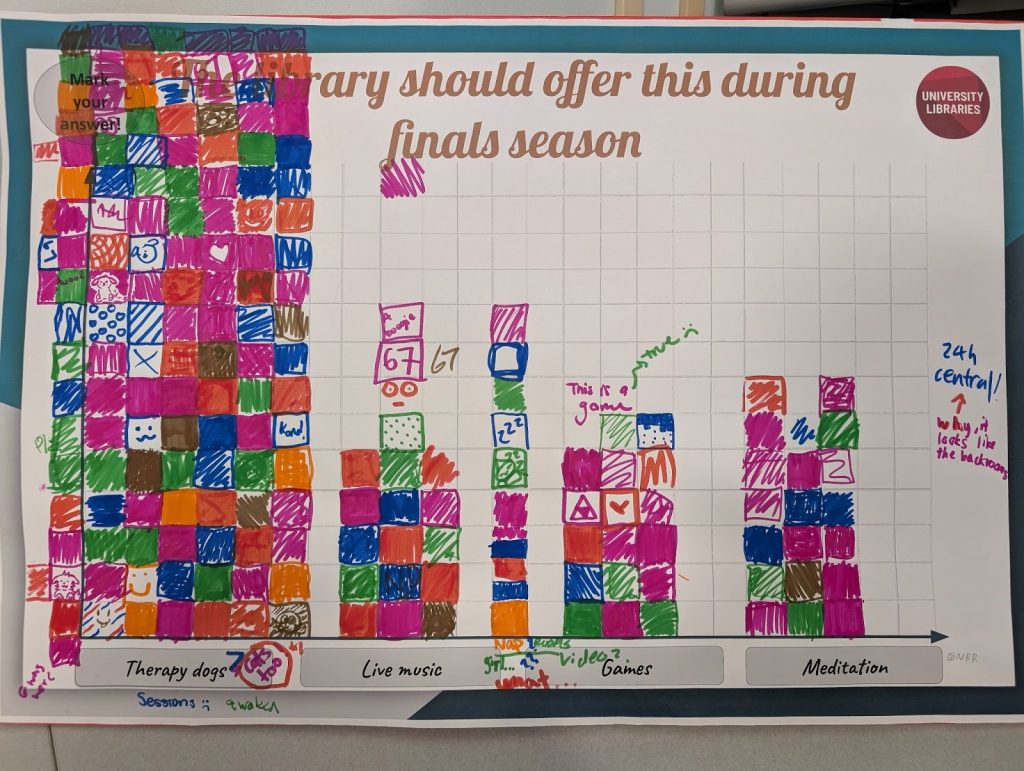
- Playful or exaggerated responses, particularly for stress-related topics (e.g., finals), where students may treat the activity as stress relief or an echoing exercise (Fig. 2).
- These issues are less concerning if the goal is qualitative insight or engagement rather than precision.
What to know more?
We’ll be sharing additional details about the implementation, lessons learned, and technical considerations from this pilot during Love Data Week. Join us for the talk and stop by our open house table this week!
Example charts
Some charts were designed primarily to spark curiosity and engagement (Figs. 1-2), some to extract meaningful insights (Figs. 3-4), and others to help us better understand our audience and improve services (Figs. 5-7).
===============================
Purely engaging
===============================
===============================
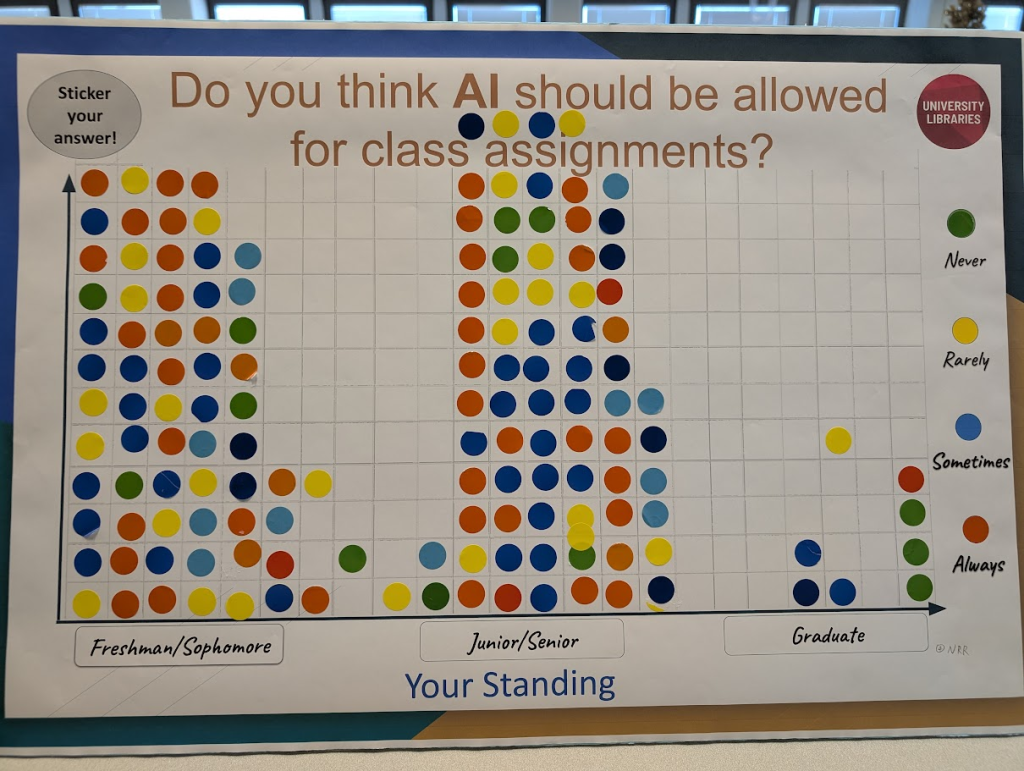
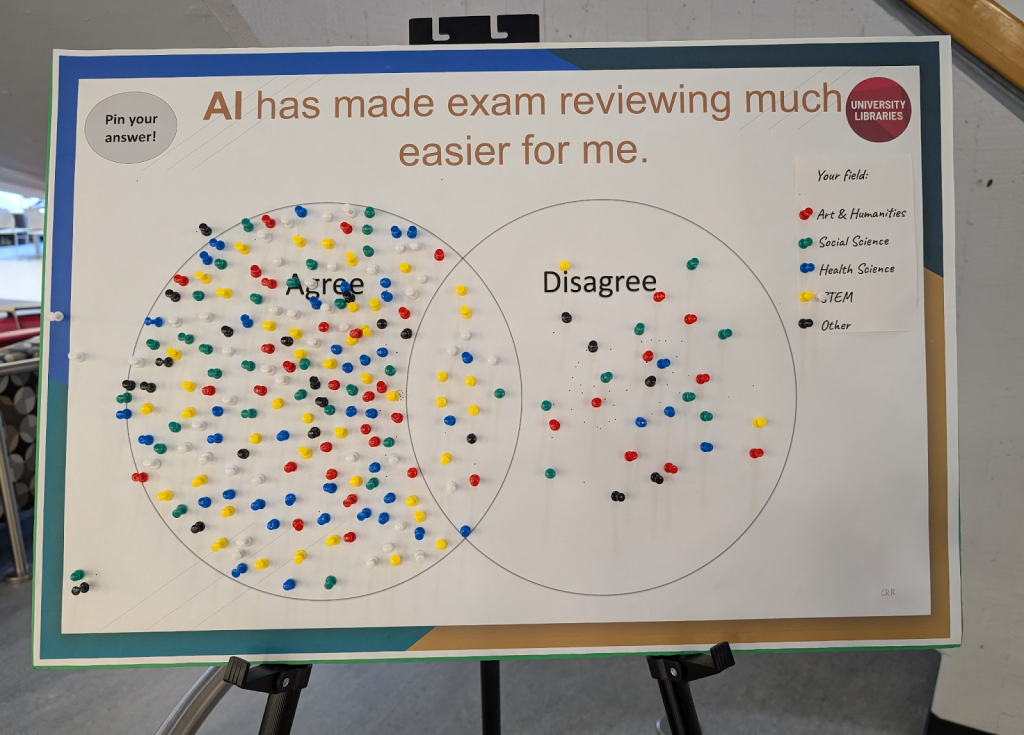
Extracting meaningful insights
===============================
=================================================
Know our audience and improve services
==================================================
Xian Bak
Latest posts by Xian Bak (see all)
- Love at First Data Point: Interactive Data Collection - February 9, 2026